
What is Business Intelligence? How to Analyze Your Business Data with AI (Even If You're Not an Expert)
You have the data. But do you have answers?
If you're a small business owner, freelancer, or agency, you're sitting on a goldmine of data: sales receipts, website traffic, social media engagement, client invoices. But here's the problem: this data is useless if you can't analyze it.
Our Google Trends research shows one of the most common, fastest-growing searches is 'how to analyze business data.' You know you need to do it, but it feels complex, expensive, and reserved for data scientists with complex dashboards.
It's time to change that. Let's break down what Business Intelligence (BI) really is and how our AI toolkit makes it accessible to everyone.
What is Business Intelligence (BI)?
Business Intelligence (BI) is not as complicated as it sounds. It's simply the process of turning your raw data into plain-English, actionable insights so you can make smarter decisions.
- Data:
You sold 100 products last month. - Insight (BI):
Your sales in Gauteng grew 20%, but your sales in KZN are down 5%, driven by a drop in your 'Widget B' product. - Action:
Pause marketing for Widget B in KZN and double down on your Gauteng ad spend.
The problem is that getting this insight (the "why") has always been the hard part.
The "Old Way" vs. The "New AI Way"
- The Old Way: Buy expensive, complex BI software, hire a consultant, and spend weeks trying to build charts. Or worse, spend hours manually copy-pasting data into an Excel sheet just to make a graph you don't understand.
- The New AI Way: You ask a question in plain English, and AI gives you the answer. You upload your messy documents, and AI analyzes them for you.
This is where App Design Hub's BI tools come in.
1. The Market Research Tool: Ask About the World
Before you can analyze your own data, you need to understand the market. Our Market Research Tool uses Google's latest Maps and Search grounding APIs to answer your strategic questions.
- You Ask: "What are the main industries in Gauteng?"
- AI Answers (with a Map): "Gauteng's economy is driven by finance, manufacturing, and tech. Here is a map of the key industrial areas..."
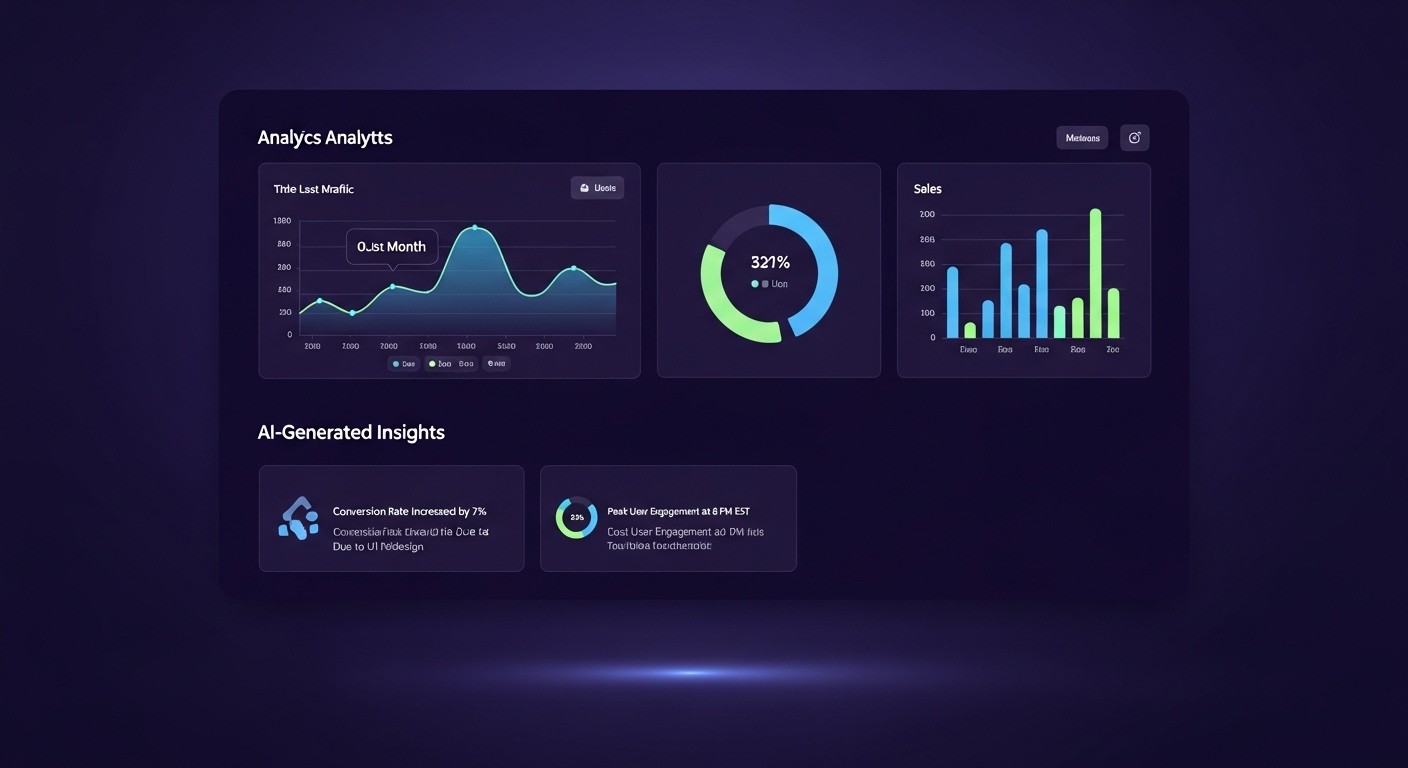
2. The Analytics Megahub: Chat With Your Own Data (RAG)
This is your company's private brain. You can upload your PDF invoices, sales reports, or even your client's food safety documents.
- You Upload: 50 food safety test reports.
- You Ask (in the AI Chat): "How many 'fail' results did we have in Gauteng last month?"
- AI Answers: "You had 4 'fail' results in Gauteng. They were all related to 'E. coli' at Facility A."
- The Analytics Tab automatically graphs this, showing you a "Pass/Fail Rate Over Time" without you lifting a finger.
3. The Smart Sales Forecaster: Predict the Future
Stop guessing what next month's sales will be. Our Smart Sales Forecaster (like the one on our homepage demo!) can analyze your past sales data and give you an AI-powered forecast.
Start Making Data-Driven Decisions Today
You don't need to be a data expert to analyze business data. You just need the right tools.
Stop letting your data go to waste. Use your 30 free credits to try our Smart Sales Forecaster or explore the Analytics Megahub today.
",